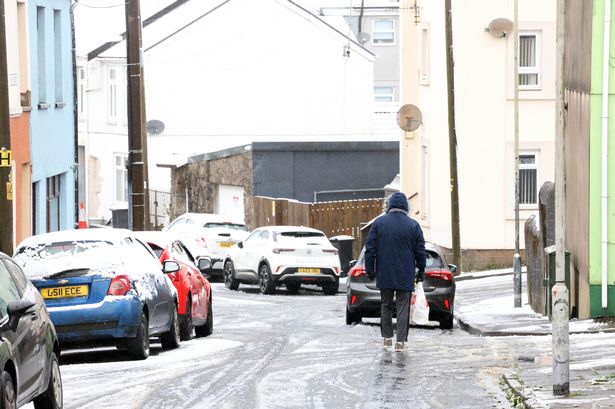
New high-resolution climate models are providing a granular look at potential temperature extremes across the UK in the coming years, offering a glimpse into possible cold snaps before 2025. While these models don’t provide specific forecasts, they paint a picture of potential temperature dips and highlight areas most likely to experience the chilliest conditions. Initial analysis suggests that some major UK cities could see temperatures plummet to as low as -2°C, a significant drop that could have various implications for infrastructure, transport, and daily life. These projections, however, need to be understood in the context of broader climate change trends, which generally point towards a warming climate overall. The occurrence of cold snaps within a warming world emphasizes the increasing variability and complexity of our climate system.
The data underpinning these new weather maps comes from advanced climate models, often referred to as regional climate models (RCMs), that divide the UK into a grid of smaller squares, each representing a specific location. This fine-grained approach allows for a more detailed representation of local climate variations influenced by factors such as topography, proximity to the coast, and urban heat island effects. Traditional global climate models operate at a coarser resolution, making it difficult to capture these localized influences. By downscaling global climate projections to a regional level, RCMs provide a more nuanced view of potential future climate scenarios, including the frequency and intensity of extreme temperature events like cold snaps. This enhanced resolution enables city-specific assessments, allowing urban planners and emergency services to better prepare for the potential impacts of extreme cold.
The potential for temperatures to drop to -2°C in major UK cities underscores the importance of preparedness for cold weather events, even within a generally warming climate. While -2°C might not seem exceptionally frigid, such temperatures can still pose challenges, particularly if they persist for extended periods. Impacts can range from disruptions to transportation networks due to ice and snow to increased energy demand for heating, which can strain power grids. Vulnerable populations, such as the elderly and homeless, are particularly susceptible to the health risks associated with cold weather. Understanding the potential for these cold snaps allows for proactive measures, such as winterizing homes, ensuring adequate supplies of essential goods, and implementing cold weather alert systems to protect vulnerable individuals.
While these new maps provide valuable insights into potential cold weather extremes, it’s crucial to acknowledge the limitations inherent in climate modelling. These models are sophisticated tools that simulate the complex interactions within the Earth’s climate system, but they are not perfect representations of reality. They rely on assumptions and simplifications, and their outputs are subject to uncertainties. The -2°C figure, therefore, represents a potential outcome based on current understanding of the climate system, not a guaranteed prediction. Moreover, these models project potential weather patterns, not specific weather events. They indicate the likelihood of experiencing certain temperature ranges but don’t pinpoint the exact dates or durations of these cold snaps.
Interpreting these projections within the broader context of climate change is essential. While localized cold snaps can and do occur, the global trend is unequivocally towards a warming climate. The increasing concentration of greenhouse gases in the atmosphere is trapping more heat, leading to a rise in average global temperatures. This warming trend doesn’t preclude the occurrence of cold weather events; in fact, some research suggests that climate change can even influence the dynamics of atmospheric circulation patterns, potentially leading to more erratic weather swings, including occasional periods of intense cold. Therefore, while preparing for potential cold snaps is important, it should not overshadow the larger imperative of mitigating climate change by reducing greenhouse gas emissions.
The insights provided by these new weather maps emphasize the increasing complexity and variability of our climate system. They highlight the need for both adaptation and mitigation strategies. Adaptation measures involve preparing for the potential impacts of climate change, including both extreme heat and cold events. Mitigation strategies, on the other hand, focus on reducing the underlying drivers of climate change by curbing greenhouse gas emissions. By integrating both approaches, we can enhance our resilience to climate change impacts while simultaneously working to address the root causes of the problem. These new weather maps serve as a valuable tool for informing adaptation planning at the local level, allowing cities to better prepare for the diverse range of climate challenges that lie ahead.


